Select a chart on the right
BTC |
ETH |
LTC |
EOS |
ADA |
XTZ
Trend | Momentum | Volume | Volatility
Trend | Momentum | Volume | Volatility
Momentum
💡 How strong the trend is
💡 Tells you if a reversal is going to occur
💡 Picking out price tops and bottoms
- Relative Strength Index (RSI)
- Stochastic
- Average Directional Index (ADX)
- On-Balance Volume (OBV)
- Ichimoku Kinko Hyo (aka. Ichimoku Cloud)
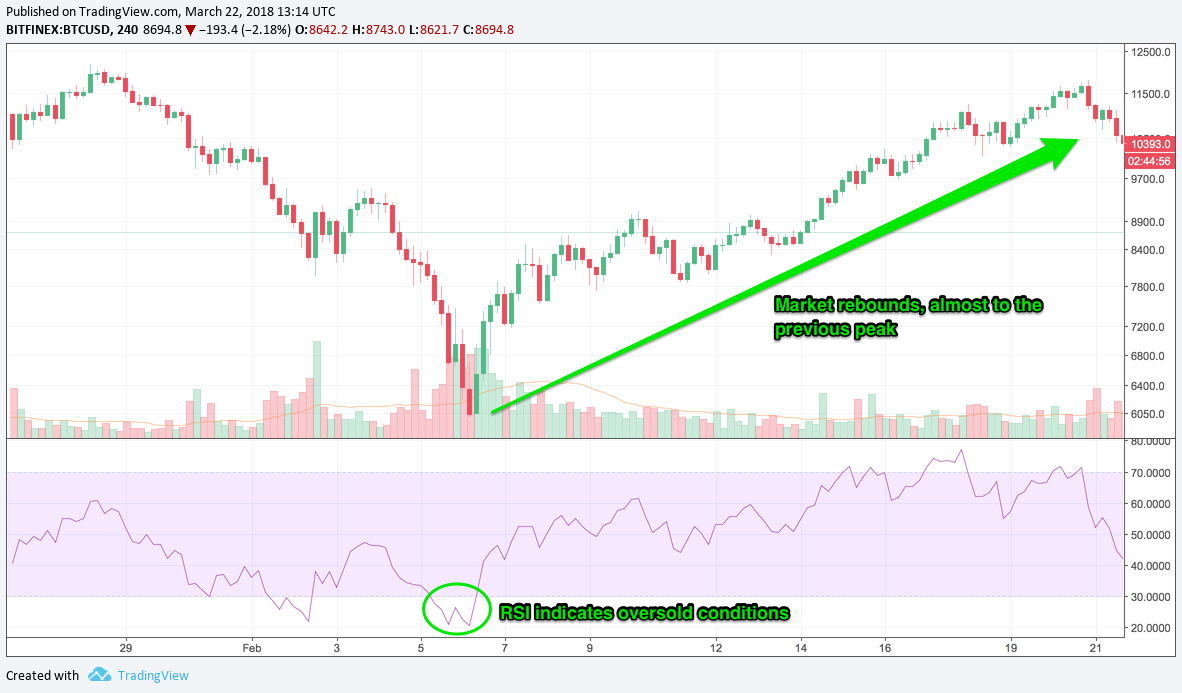
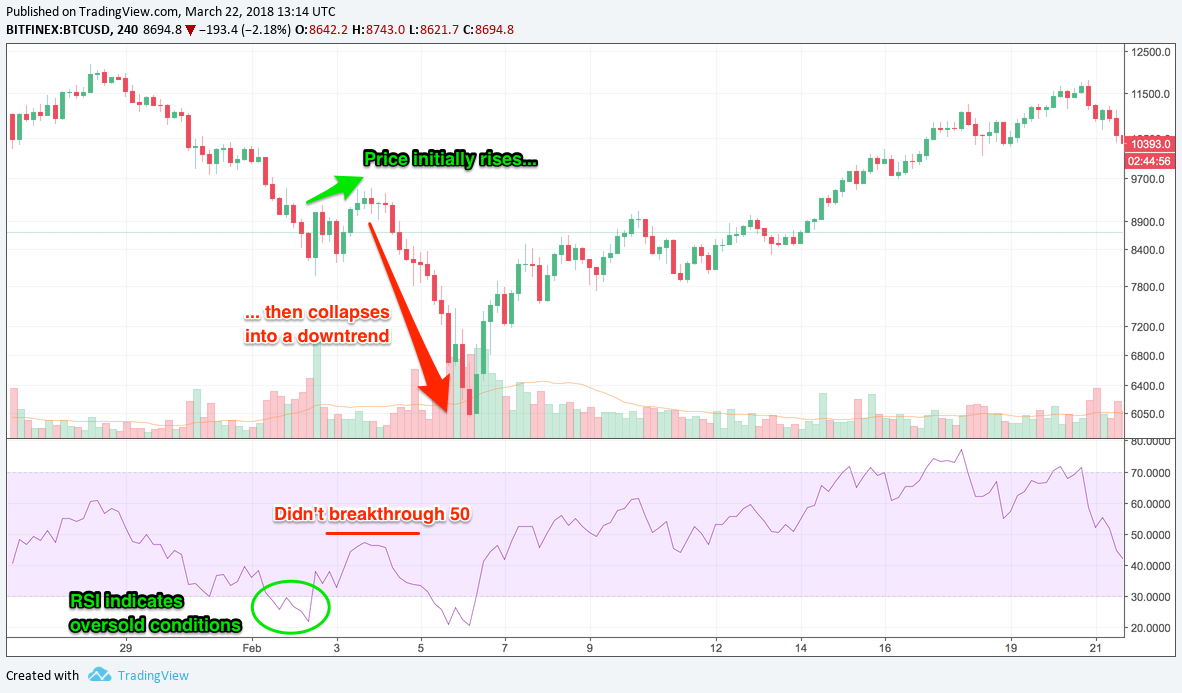
Relative Strength Index (RSI)
(» Show chart «)Single line scaled from 0 to 100.
> 50 = 📈 probably uptrend
> 70 = overbought = sell
< 50 = 📉 probaby downtrend
< 30 = oversold = buy
⚠️ Beware of fakeouts!
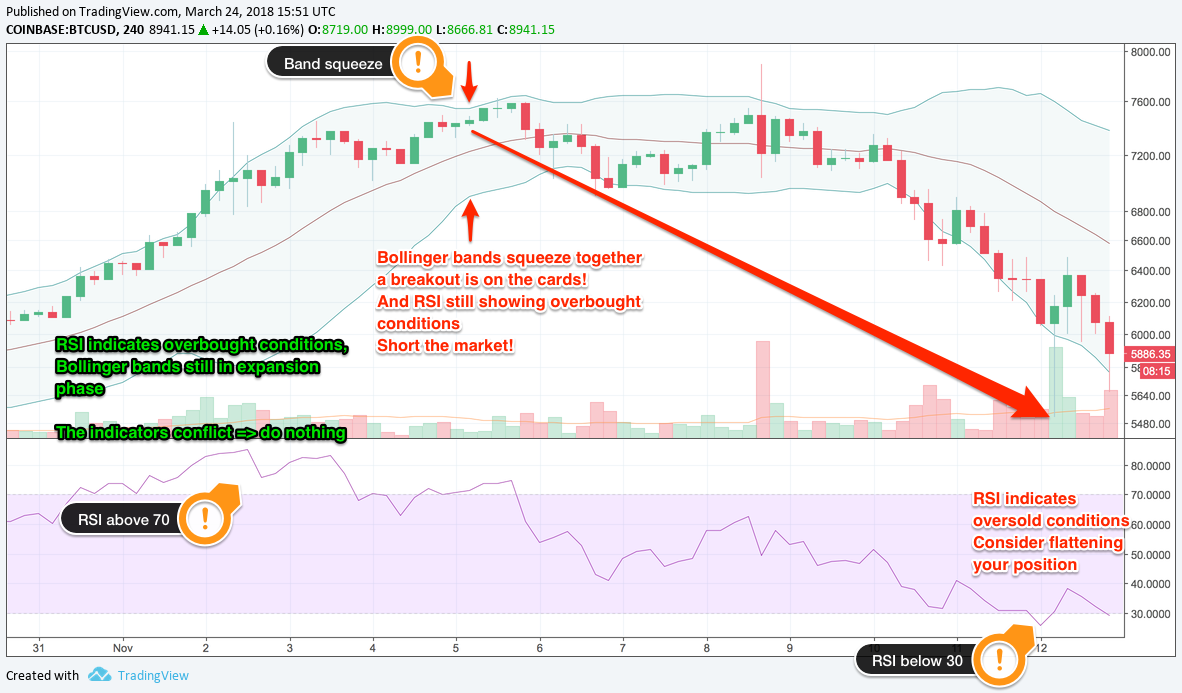
RSI & Bollinger Bands
(» Show chart «)
Confirmation when the market is turning.
-
RSI:overbought
Bollinger Bands: still expanding = no action! -
RSI: overbought.
Bollinger bands: started to contract = market is getting quiet. -
RSI: overbought
Bollinger bands squeeze together
📉 Both indicators agree to sell! The market is ready to move down.
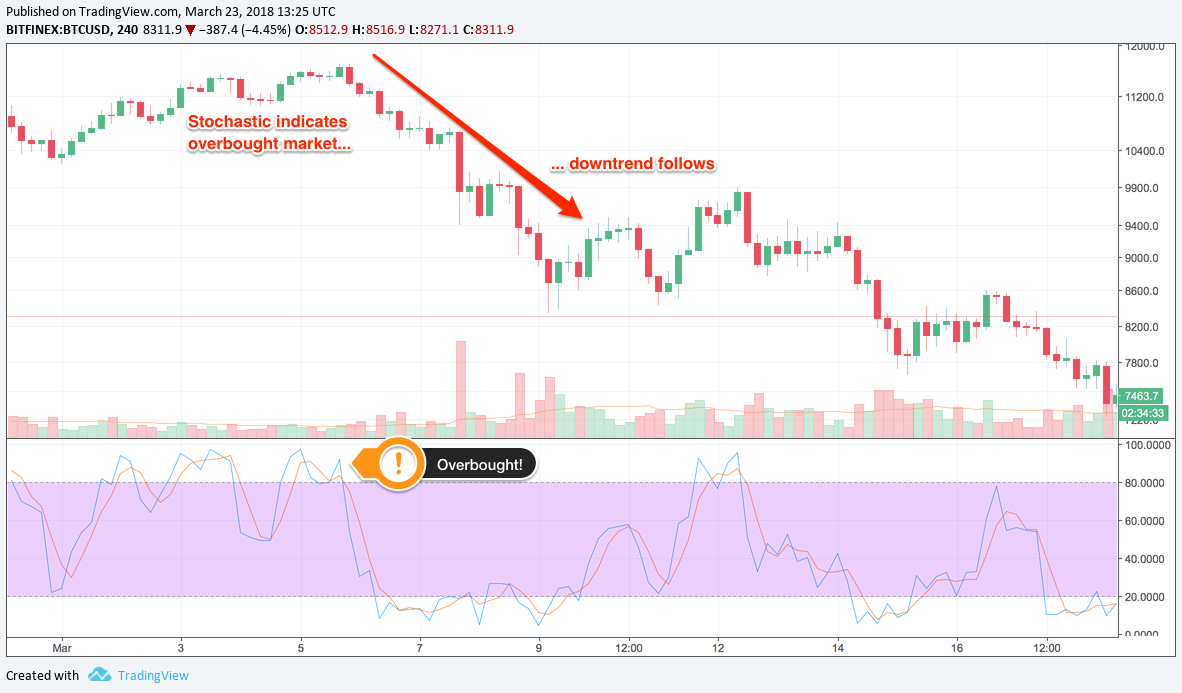
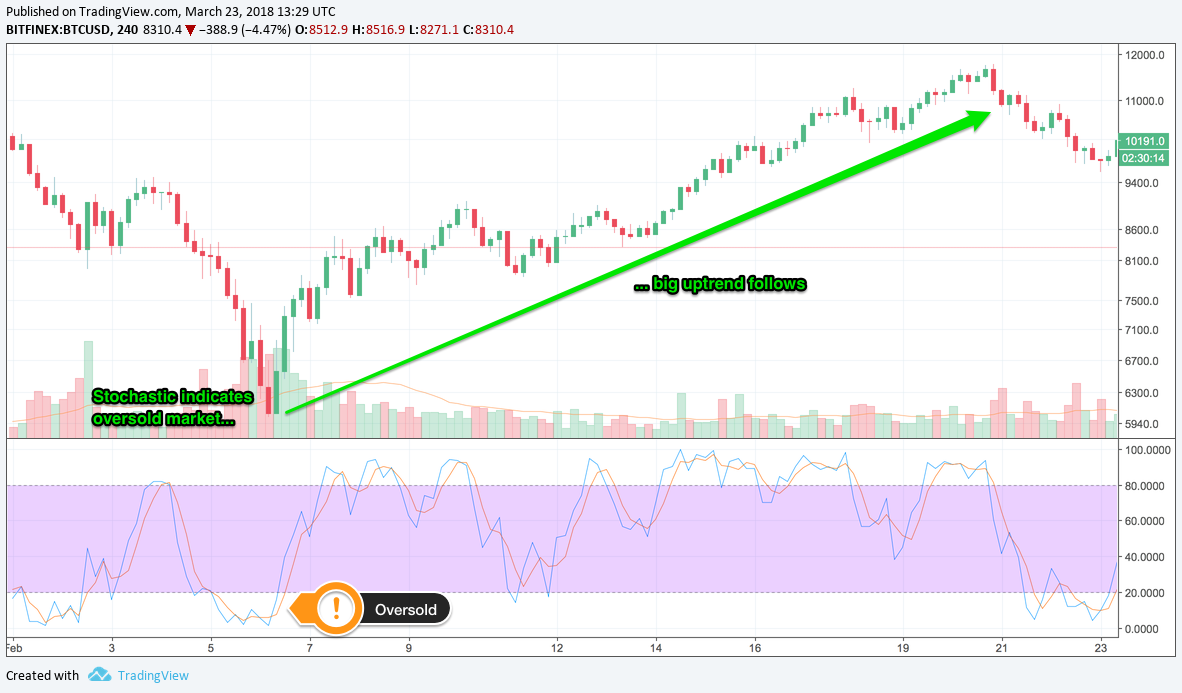
Stochastic
(» Show chart «)Find where a trend might be ending and where the market is likely to go.
Determine when an asset is overbought or oversold.
Pick an entry point = get into a trend at the very beginning.
> 80 = overbought = 📉 downtrend likely to follow.
< 20 = oversold = 📈 uptrend likely to follow.
⚠️ Beware of fakeouts!
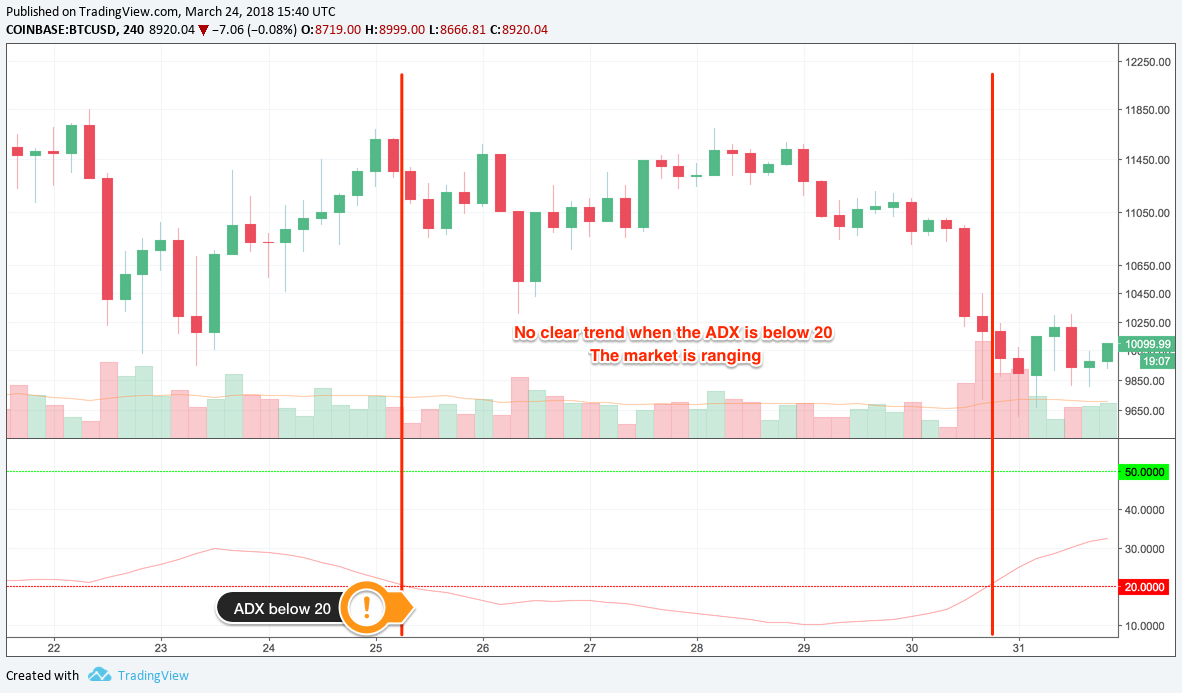
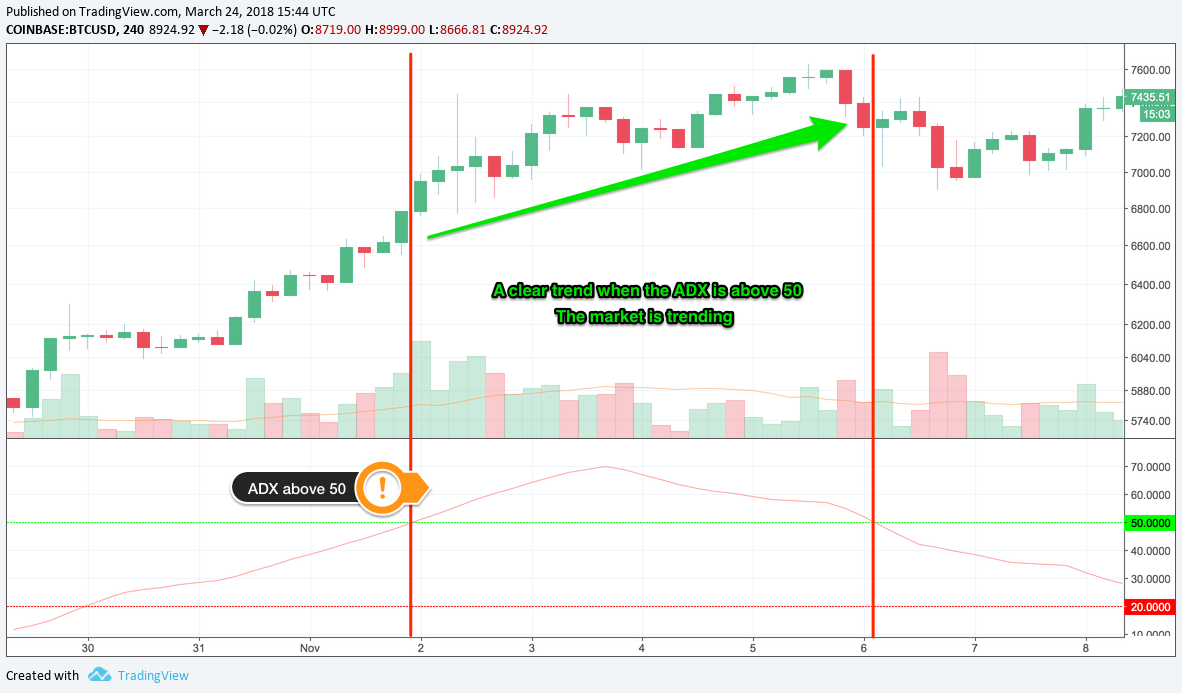
Average Directional Index (ADX)
(» ADX DI+/DI- chart «)Signal of trend strength
Strength of the trend, NOT the direction
Range from 0 to 100
< 20 = weak trend
> 50 = strong trend
- Use ADX to avoid fakeouts.
- Best used in combination with other indicators.
- Combine with a directional trend indicator (eg. Parabolic SAR).
- Confirm that a trend is strong and is going to continue (gives you more confidence).
Settings:
- ADX: yellow
- DI+: green
- DI-: red
Yellow: shows the strength of the trend.
Green line above the red line: bulls are in control
Red line above the green line: bears are in control
Can help you to exit the trade when the trend weakens = avoid getting caught by price retracements.
⚠️ ADX lags behind the price, so is not useful if you want to get in on trends early.
On-Balance Volume
Includes
- time
- volume
- price
Theory behind it: distinction between smart money and retail investors.
- Retail investors sell, while institutions begin buying.
- Volume may increase even as the price remains relatively level.
- Volume drives up the price
- Large investors begin to sell, small investors begin buying.